Google Ads Budget Pacing
Keep Your Spend on Track
Connect your Google Ads account to Google Sheets and visualize how your campaigns are pacing in Looker Studio. With daily updates it’s a no-fuss way to monitor spend and avoid surprises.
What Is Google Ads Budget Pacing?
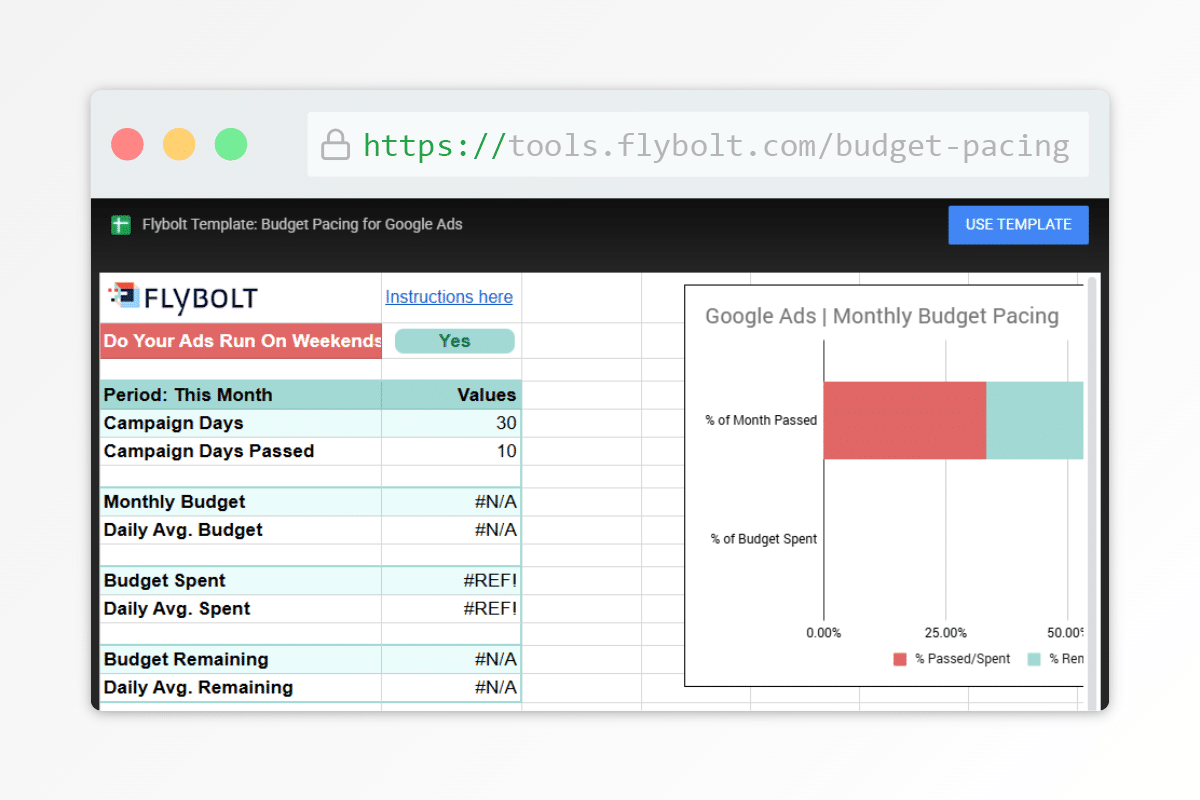
Budget pacing is the practice of tracking how your ad spend is trending over time compared to where it should be at this point in the month. Instead of finding out too late that you’ve overspent—or worse, left budget unused—pacing gives you an early warning system.
Think of it like a fuel gauge for your campaigns. You’re not just watching how fast you’re going; you’re making sure you’ll reach the finish line without running out of gas or flooding the engine.
Why Budget Pacing Matters
Google Ads doesn’t automatically protect you from pacing issues. Campaigns can ramp up quickly, fluctuate with demand, or overspend earlier in the month—especially if budgets are shared or strategies change.
A simple pacing report helps you:
- Spot overspend or underspend early
- Make mid-month adjustments with confidence
- Avoid end-of-month budget scrambles
- Keep performance and cash flow aligned
Create Your Google Ads Budget Pacing Report
This template connects Google Ads directly to Google Sheets and updates daily, giving you a clear, reliable view of where your spend stands and where it’s headed.
Step 1: Access the Google Sheets Template
- Click the button above or this link to open the template preview: https://tools.flybolt.com/budget-pacing
- Click Use Template
Step 2: Install the Google Ads Add-on (if not already installed)
- If prompted, install the Google Ads Extension.
- Otherwise, in the menu bar navigate to Extensions > Add-ons > Get add-ons.
- In the marketplace modal, search for Google Ads.
- Click the Google Ads extension from the search results, and click Install.
- Select Your Google Account and follow the prompts to grant Google Sheets the necessary permissions.
- Once the Google Ads extension has been installed, click Done.
Step 3: Create Your Report
- In the menu bar, navigate to Extensions > Google Ads > Create New Report.
- If prompted, sign into your Google Ads account.
- This creates a Report Configuration tab with a side sheet labeled “Create a new report”.
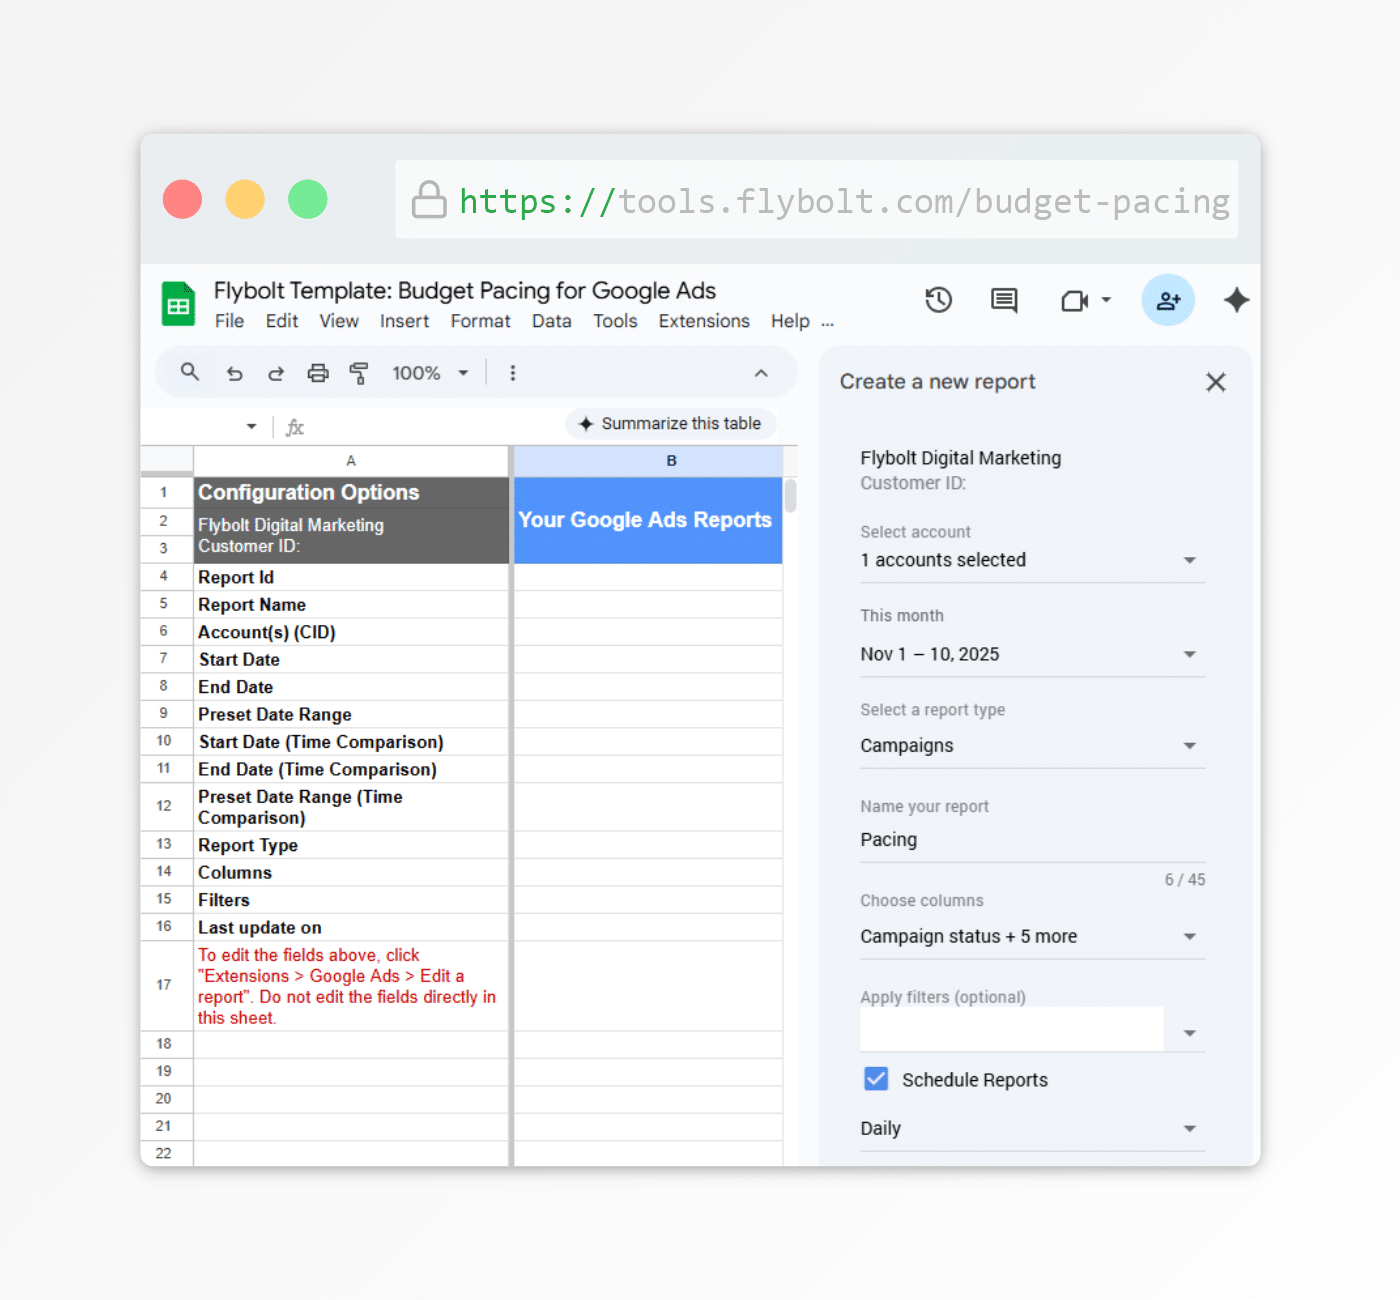
- In the side sheet, select your account from the drop down list.
- Set your date range to This month, and click Apply.
- Select the Campaigns report type from the drop down.
- Name your report Pacing.
- Select two columns:
- Day from the Segments section
- Cost from the Performance section
- Apply filters if you wish (optional).
- NOTE: The formulas in this template already filter for enabled campaigns.
- Select Schedule Reports and choose Daily.
- Click Create report.
- This creates a new report worksheet.
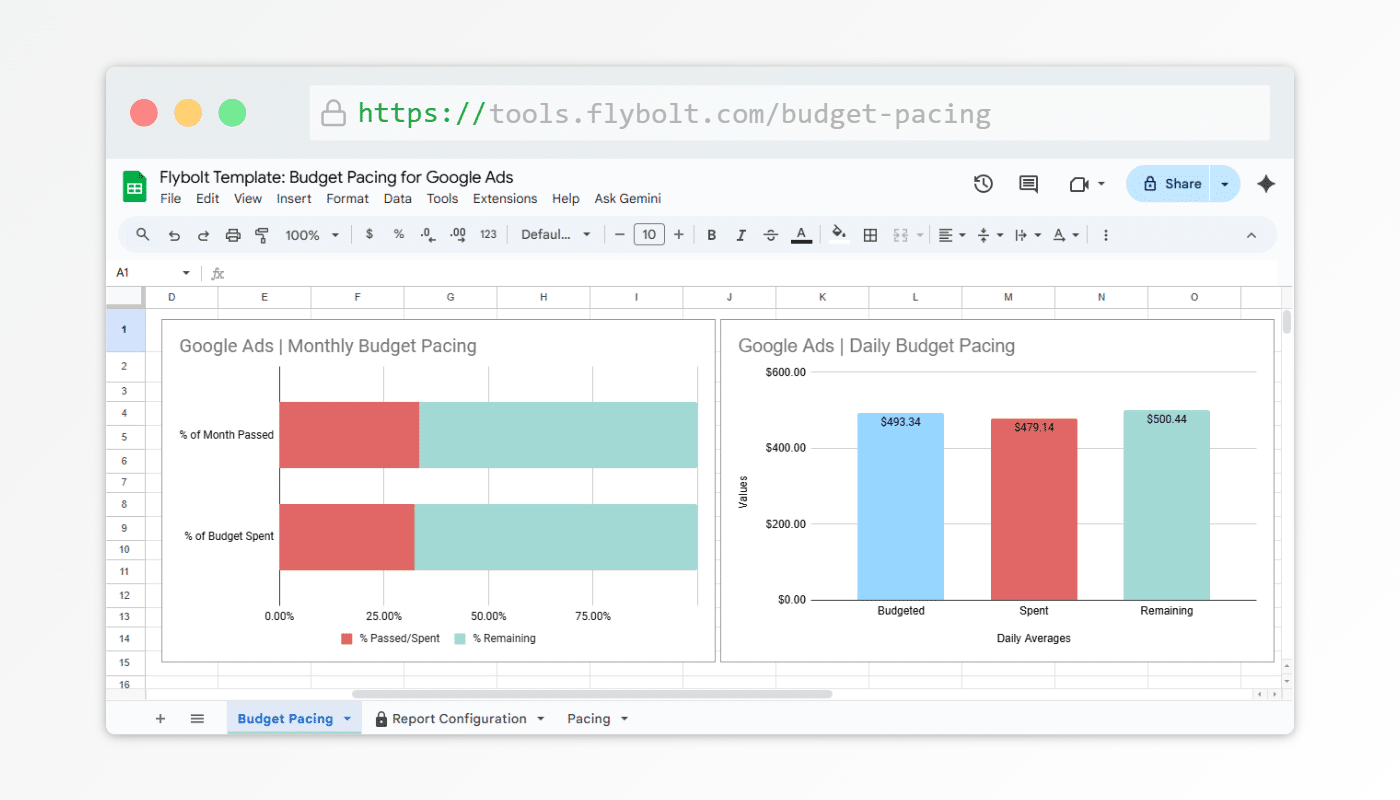
Step 4: View Your Budget Pacing Report
- Navigate back to the Budget Pacing tab to view your summary and charts.
At this point, your budget pacing report is fully functional in Google Sheets. You can use it as-is to monitor spend.
If you plan to share individual charts outside of Sheets in dashboards, presentations, or reporting tools, follow the next steps to publish them as standalone visualizations.
Step 5: Publish Your Budget Pacing Charts
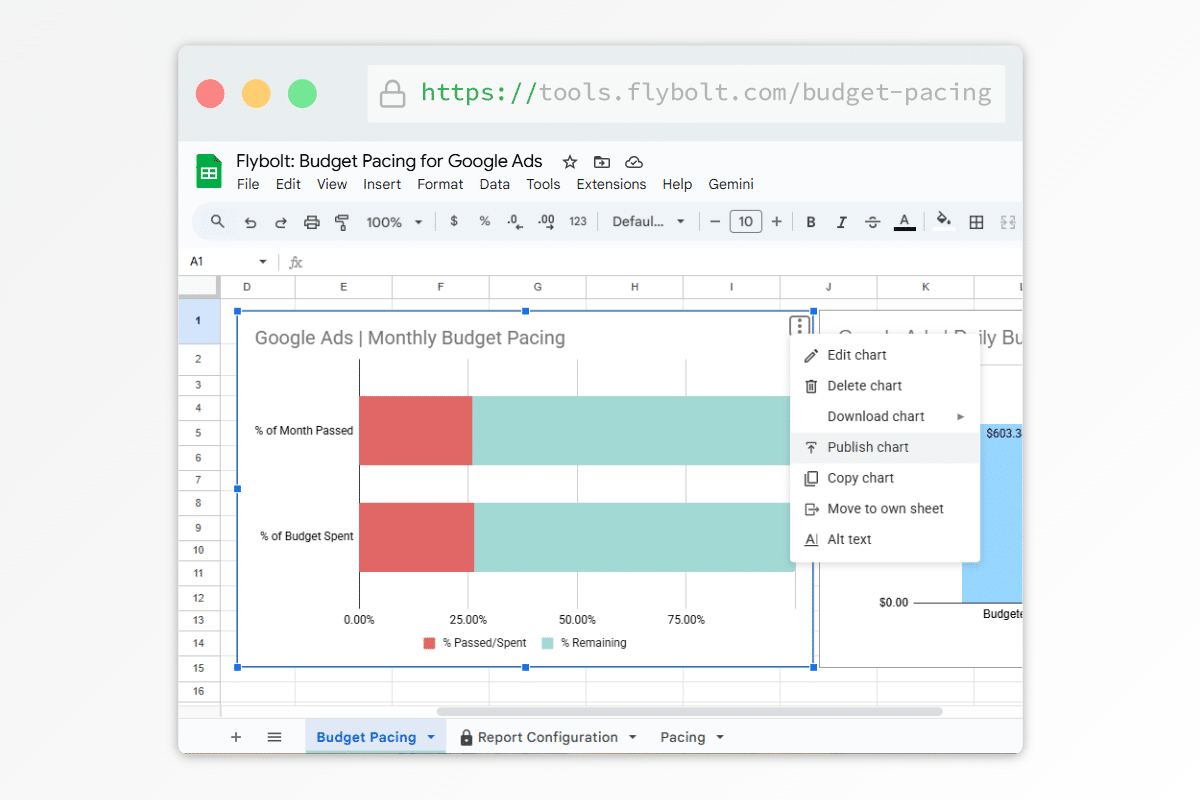
- Click on the chart you want to share to select it.
- In the chart’s top-right corner, click the three dots icon ⋮
- From the menu, select Publish chart.
- In the pop-up window, on the Link tab click the blue Publish button.
- Click OK on the confirmation prompt.
- A unique URL will be generated; copy this link.
Step 6: Embed Budget Pacing Charts in Looker Studio
- In Looker Studio, Edit your report.
- In the menu bar click Insert, and select URL embed from the dropdown (or click the URL embed icon in the toolbar < >). Your cursor will change to crosshairs so you can draw a frame on the canvas.
- Move and resize the frame as needed.
- In the Properties panel, go to the Setup tab.
- Paste the URL of the chart you published in the External Content URL field.
Looker Studio is just one option. If you use another reporting tool or internal dashboard that supports embedded URLs, the same published chart links can be used there as well. If you found this guide useful, let us know.
